-
Call Now
1800-102-2727

Graphs: Position-Time, Velocity-Time, Inter-Conversion, Practice Problems and FAQs

You ride to school by bike everyday. You start from rest, pedal faster, reach a certain velocity say 5 ms-1, in 10 s. Would you be able to find the displacement in 10 s? Short answer : yes, if you applied equations of motion. Another approach would be to take a pen and paper, plot a simple graph with velocity on one axis and time on the other; the area under such a graph would give displacement. On the other hand, plotting graphs of displacement x and time t gives us an idea about the velocity.
A graph plotted between velocity V on the y - axis and time t on the x - axis is called velocity time graph or v - t graph. Similarly, a graph plotted between position x on the vertical axis and time x on the horizontal axis is called position- time graph. With the information of v - t graph, both displacement and acceleration can be calculated. Before we dive into the details, one must understand two vital terms: slope and area. Slope is defined as the tangent of the angle which the line or tangent to the curve makes with the +Ve direction of x - axis; in the following graph for instance; slope of the curve

slope of x-t curve gives velocity
Area under the graph is the area the curve encloses with x - axis. Area under the v - t graph gives the displacement of the body

Area under the v-t curve gives displacement
Table of Contents
Displacement Time Graph
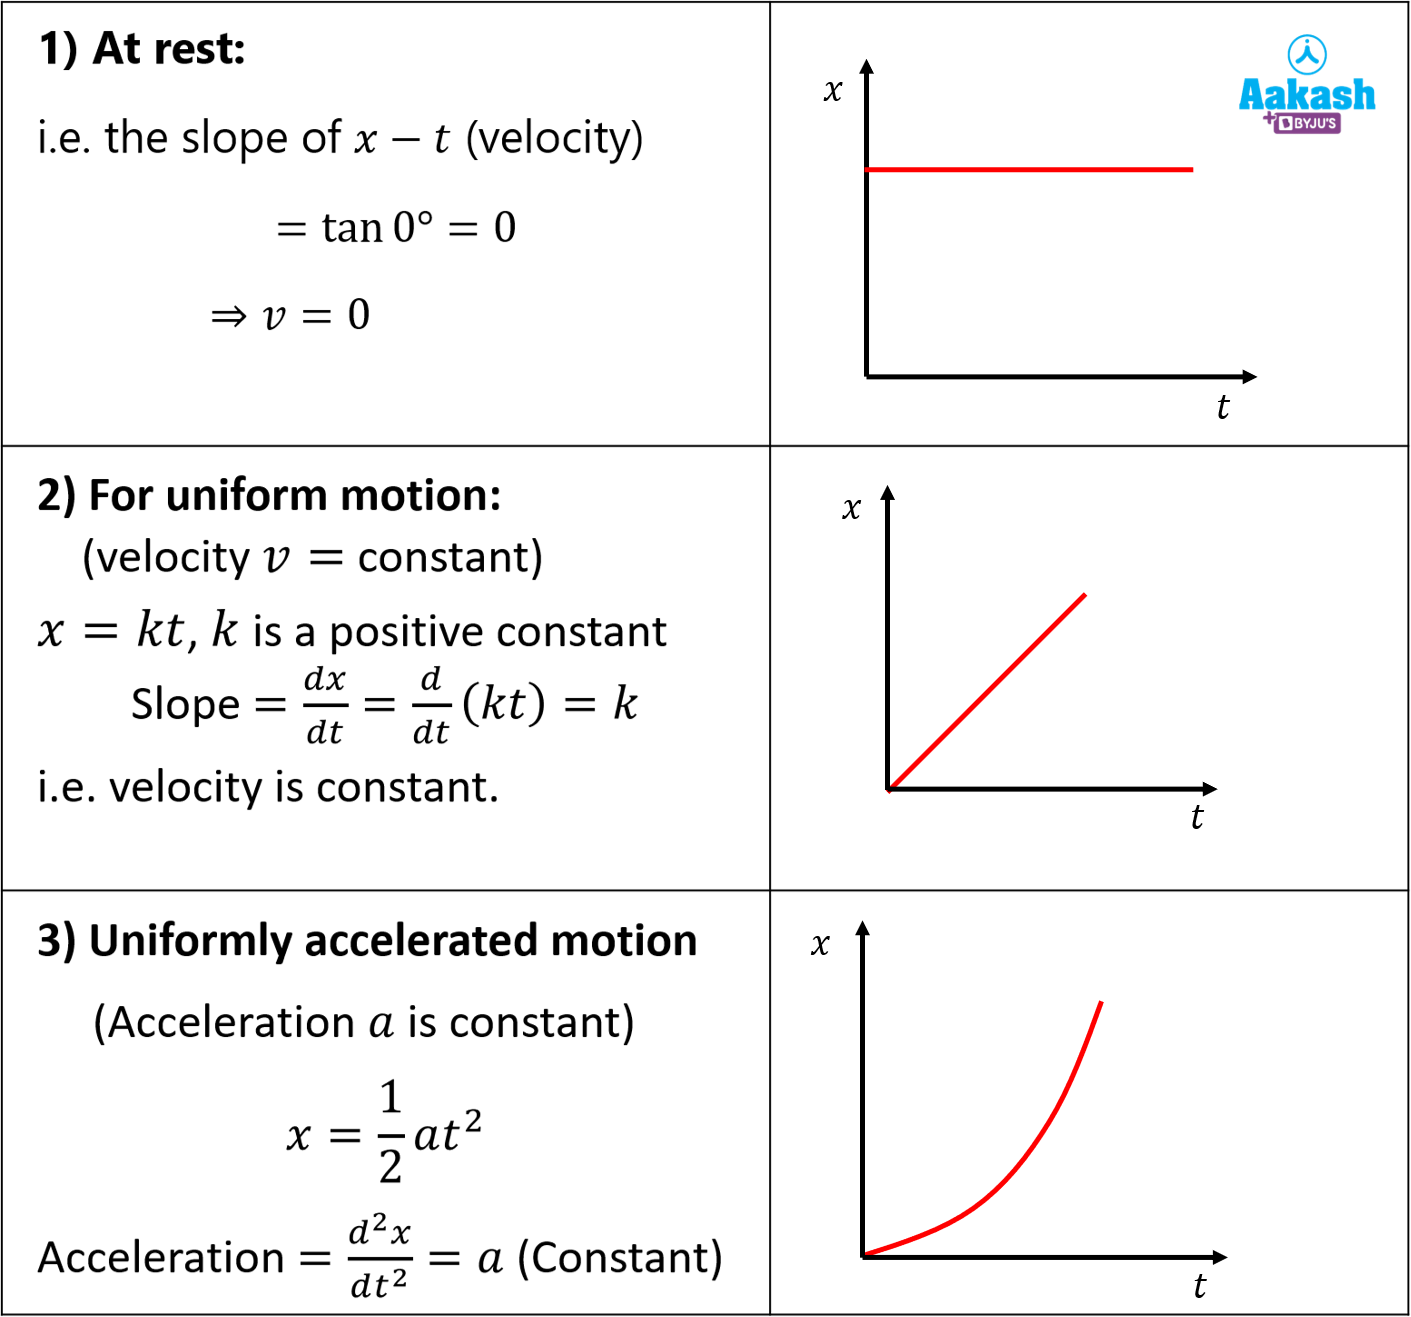
- Graph plotted between position/displacement on the y - axis and time t on the x - axis is called position/displacement - time or x - t graph.
- Slope of the x - t graph gives velocity.
The x - t graph for various cases is shown.
Note: If acceleration is a function of position or time, then such acceleration is said to be non uniform.
Velocity Time Graph
- A graph plotted between velocity v on the y - axis and time t on the x - axis is called the v - t graph.
- Slope of the v - t graph gives acceleration.
- Area under the v - t graph gives displacement.
The v - t graph for different cases is as shown.

Note:
- The mathematical interpretation of slope of a graph is its derivative
 .i.e differentiating displacement x wrt time t gives velocity. The same applies for acceleration;
  , differentiating velocity v wrt time t gives acceleration a.
 - Integration refers to finding area under the graph. For example;

i.e area under v - t graph gives the displacement.
Practice Problems of Graphs
Question 1. A person walks 10 m in the positive direction in 5 seconds, then stops for 2 seconds, and then walks 15 m in the negative direction for 5 seconds. Draw his displacement-time graph.
Answer: The motion can be summarized as follows:
(i) 10 m in the positive direction from 0 to 5 seconds.
(ii) At rest from t = 5 to t = 7 s
(iii)15 m in the negative direction from t = 7 to t = 12 s
The following diagram represents his motion

Question 2. The x - t (position time graph) of an object moving in a straight line is shown. Calculate the average velocity in the time interval
(i)t = 2 to t = 4 s
(ii)t = 4s to t = 6 s

Answer: 
Question 3. Given below is a v - tgraph, find the (i) displacement in first 3 seconds (ii) acceleration in first 3 seconds.

Answer: 
Question 4. From the displacement time graph given below, find velocity?


FAQs of Graphs
Question 1. Draw the v - t graph for a stone thrown upwards;
Answer: Acceleration a = - g for a stone thrown up; 

Question 2. Draw the v - t graph for a ball thrown downwards from the top of a tower.
Answer: For a ball thrown downwards; 

Question 3. How to find acceleration from v - t graph?
Answer: Slope of the v - t graph gives acceleration a.
Question 4. How to find displacement from v - t graph?
Answer: Area under the v - t graph gives displacement.
Related Topics to Position Time and Acceleration Time in Physics
- Measurement of speed
- Motion parameters
- Acceleration
- Derivations of equations of motion
- Velocity
- Motion under gravity
- Velocity Time ans Acceleration Time