-
Call Now
1800-102-2727


Distance Time graph - Definition, Examples, Practice problems, FAQs
Shriya starts her scooty and drives to work. She finds that her speedometer isn’t working. So she keeps note of the distance she covers in different instances of time. For example, let’s assume she has traveled 5 m in 1 s, 2.5 m in the next 1 s, 7.5 m in the next 1 s. A graph can be plotted between distance on the vertical axis and time on the horizontal axis. Such a graph could be a straight line or a curve depending upon how much she accelerates. She then reaches the office and plots her data on a paper and gets a straight line. Now how is she going to find the speed from this graph? Also, do you think it would be possible for her to plot another graph showing the velocity of her scooty versus the time? The answer is yes– with the knowledge of distance time graphs, it is possible to find velocity and even acceleration if possible. In this article, we will explore distance-time graphs in detail.
Table of contents
- What is a distance time graph?
- Distance time graph for various motions
- Practice problems
- FAQs
What is a distance time graph?
A graph plotted between distance (x) on the Y- axis and time (t) on the X- axis is called the distance time graph or x-t graph in short. Parameters like velocity and acceleration can be calculated from it when we properly know the directions. Let v indicate the instantaneous speed, then
indicates the derivative of distance with respect to time. In case of average speed, a line drawn to the x-t curve is a secant. But in the case of instantaneous speed, the time interval becomes too small and the line becomes a tangent. The slope of the line is given by the tangent of the angle () it makes with the positive direction of the X- axis.
In other words, slope of the x-t graph gives speed.
Distance time graph for various motions
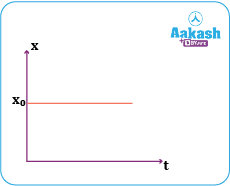
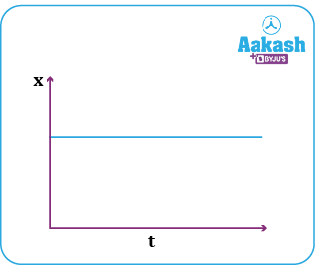
1) Position time graph between x and t for a particle at rest.
Let a particle remain at rest at a distance x0 located from the origin. The position of the particle does not change since it is at rest. Hence its x-t graph is a straight line parallel to the time axis.
2) The particle moves with constant speed towards the right.
Let a particle be located at a distance x0 from the origin. Then the equation for its distance covered with time can be written as x=x0+vt. Its speed v is +ve since it moves in the rightward direction. The graph would be a straight line with a positive intercept and makes an angle with the positive x axis. The speed can be obtained as the tangent of the angle .
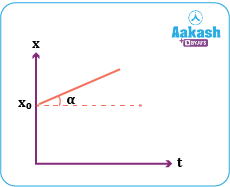
Note: when the particle moves with constant speed towards the left, its velocity becomes negative but speed still remains the same.
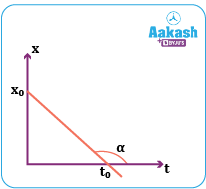
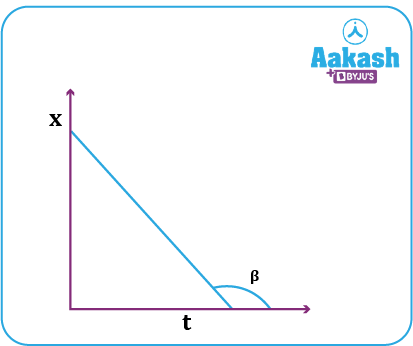
Let a particle be located at a displacement x0 from the origin. Then the equation for its displacement covered with time can be written as x=x0-vt. Its velocity v is -ve since it moves in the leftward direction. The graph would be a straight line making an obtuse angle, i.e >900. Hence, its slope would be negative. Here y axis represents the displacement. The speed will remain the same i.e., |-v|=v
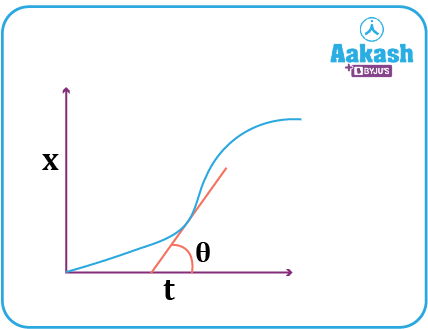
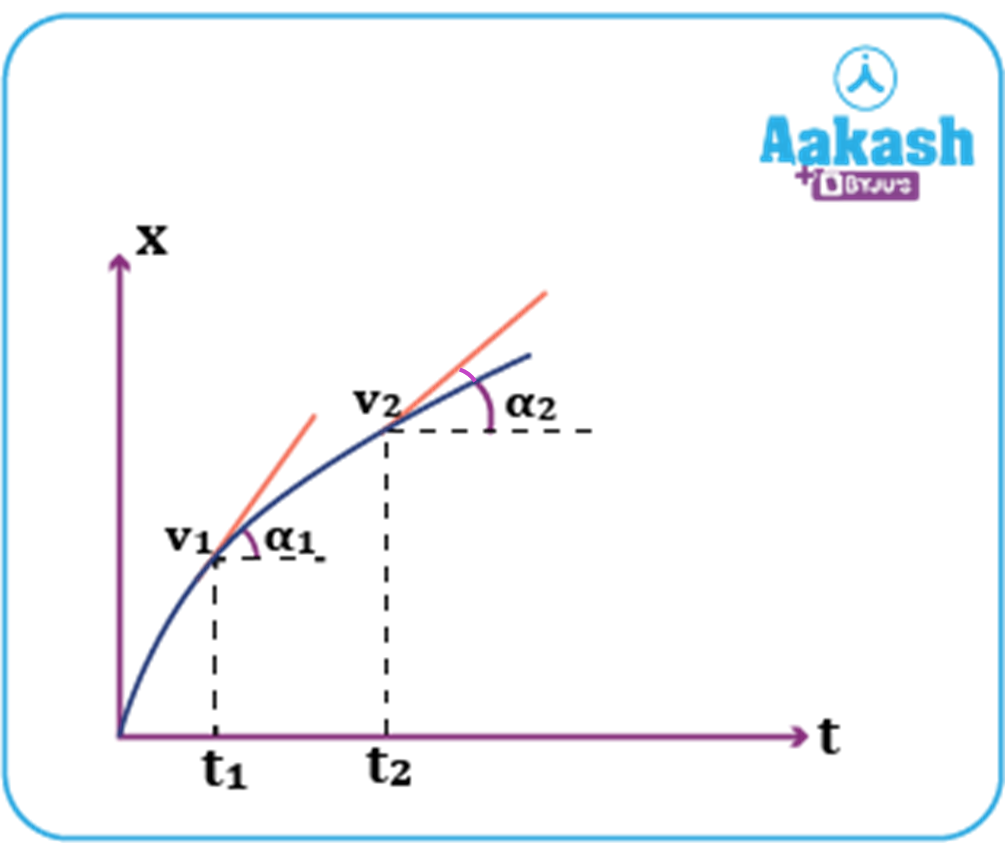
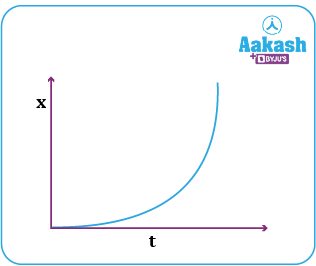
3) The particle is moving with constant acceleration towards the right.
The equation of motion for a particle moving with constant acceleration a can be written as
The graph would be a parabola and the tangent drawn to such a parabola would have a positive slope.
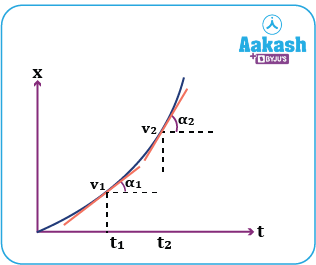
Let v1 and v2 be two different speeds (or magnitude of velocities) at two different instants of time t1 and t2. Then the slope (speed or velocity) v1=tan 1 and v2=tan 2.
From the above figure, it is clear that 2>1tan 2>tan 1.
Hence v2>v1. Hence its speed goes on increasing with time.
In case the particle is moving with reducing speed the graph will be as follows.
Since the acceleration is directed towards the left, its velocity increases towards the left, i.e., its speed decreases
This means that as time progresses, slope decreases, i.e., 2<1tan 2<tan 1.
This implies that v2<v1 i.e., speed reduces till it becomes zero and then increases again as the velocity increases in the left direction.
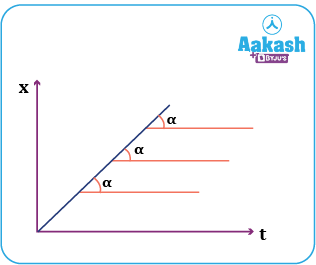
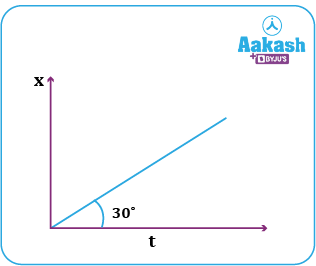
4) When the velocity of the body is constant and the particle or the body was at the origin initially.
The expression for equation of motion in this case would be x=kt, where k is a positive constant. The graph for such a motion would be a straight line passing through the origin. The line has a constant slope everywhere (tan ).
Practice problems
Q. Which of the following is the correct displacement time graph for a car at rest?
(a)
(b)
(c)
(d) None of these
A. b
For a car at rest, there is no change in its distance or displacement. Hence, the x-t graph would be a straight line parallel to the time axis.
Q. Figure shows the distance time graph of a particle. Calculate its speed (m/s).
(a) (b) (c) 1 (d)
A. a
Velocity= Slope of the displacement time
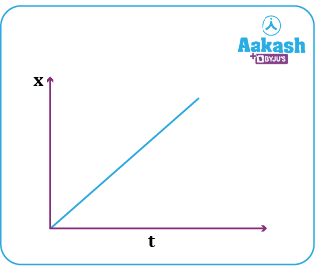
Q. Calculate the speed of a body (in m/s) between time 1 s to 2 s from the following displacement time graph shown below.
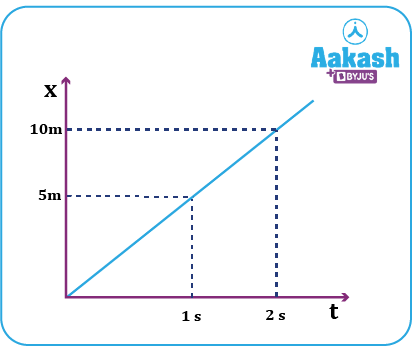
(a) (b) (c) 5 (d)
A. c
speed, v=slope in x-t graph.
Q. Draw the displacement time graph of a body whose velocity is negative.
A. When the velocity is negative, the displacement time graph has a negative slope.
Here, is an obtuse angle and tan is negative.
FAQs
Q. What are the uses of distance time graphs?
A. With the distance time graph, along with the position, we can get speed. Acceleration can also be calculated after getting the velocity time graph.
Q. What does the area under the displacement time graph give?
A. Area under the displacement time graph gives nothing significant as such. Only its slope gives velocity.
Q. How is a constant speed in distance time graph indicated?
A. Constant speed in a distance time graph is indicated by a straight line whose slope is the same everywhere. As the speed is the same, the acceleration will be zero. The straight line will have a non-zero slope. If the initial position is not the origin, then the straight line will have some non zero intercept in the distance axis.
Q. What does a horizontal line on a distance time graph signify?
A. The horizontal line indicates that the distance of the body does not change with time, i.e. it is at rest.