-
Call Now
1800-102-2727


IR Spectroscopy – Definition, Regions in IR, Sampling, Principle, Instrumentation, Working, Detection, Practice Problems and FAQ
We have often seen how significant fingerprints are! In fact, they play major roles in opening the doors to several locks! Be it a hidden vault with priceless gems, or secured cloud storage accommodating infinite confidential resources. They even serve immensely as prime evidence, in decoding murder mysteries and whodunnits.
Because each person's fingerprint is distinctive, this method of identifying people has been around for a long time. Studies indicate that both genetic and environmental factors may contribute to this complex feature, like many others. Modern fingerprint identification has been based on the idea that by looking at a person's fingerprints, one can positively identify that person and rule out everyone else. When people say that a person's fingerprints are unique to them, they imply that the pattern or arrangement of the arches, loops, and whorls on the fingers of no two individuals would be the same.

Hence the saying "no two persons have exactly the same fingerprints" really refers to "no two people do not have exactly the same arrangements of fingerprint minutiae."
IR spectroscopy is analogous to the fingerprint scanning technique! Infrared (IR) spectroscopy is an analytical technique that enables scientists and researchers to collect absorption spectra of a compound, which are a distinctive reflection of its molecular structure. It is an integral way to correctly identify and decode a particular molecule and distinguish its structure from the rest.
Let’s delve deeper into this concept!
TABLE OF CONTENTS
- What is Spectroscopy?
- IR-Spectroscopy – Introduction
- IR-Spectroscopy – Regions
- IR-Spectroscopy – Principle
- IR-Spectroscopy – Sampling
- IR-Spectroscopy – Instrumentation
- IR-Spectroscopy – Working and Detection
- IR-Spectroscopy – Applications
- Practice Problems
- Frequently Asked Questions – FAQ
What is Spectroscopy?
A technique used to investigate a molecule's properties based on how it reacts to electromagnetic radiations is known as spectroscopy. Physics, astronomy, and chemistry all heavily rely on spectroscopy to investigate matter. Resonating frequency is the cornerstone of the entire spectroscopy theory.

The following are the definitions of a few spectroscopy-related terms.
Spectra: The plural version of the word "spectrum," which describes the division of white light into its many colours, is "spectra."
Spectroscope: A spectroscope is a device used to examine the qualities of light, particularly its intensity, in order to determine the features of an item with which the light interacts.
Spectrograph: A spectrograph is a device that uses numerous detectors to detect and divide incoming light into its constituent wavelengths or frequencies.
There are various types of spectroscopic methods of analysis, namely absorption spectroscopy, flame spectroscopy, UV spectroscopy, IR spectroscopy, X-ray spectroscopy, etc.
IR-Spectroscopy – Introduction
Infrared spectroscopy is the study of how a molecule interacts with infrared light. Exposing molecules to infrared radiations (a part of the wide electromagnetic spectrum) generates molecular vibrations which manifest themselves by generating specific absorption or transmission spectra.
The following are the key characteristics of IR spectroscopy.
- Some bonds react to infrared radiation by vibrating more quickly, which is detectable and can be represented visually by a spectrum.
- Absorption, emission, and reflection measurements are detected and interpreted as the IR spectrum of a specific molecule.
- This method is mostly employed in organic and inorganic chemistry. Chemists employ it to identify functional groups in compounds.
- By measuring molecular vibrations using IR spectroscopy, the functional groups of molecules may be identified.
- Usually, heavier atoms and stronger bonds will vibrate with a higher stretching frequency (wavenumber).
- Only a bond which is polar (has negative and positive charge) can interact with infrared radiations of the electromagnetic spectrum.
- An IR spectrum can be shown as a graph with the absorbance (or transmittance) of infrared light on the vertical axis and the wavelength, frequency, or wavenumber on the horizontal axis.
- The electric field component of an electromagnetic wave can stimulate the vibrational energy of a molecule when there are distinct regions of partial positive and negative charge present in the molecule.
- The dipole moment of the particular molecule changes with the change in vibrational energy. The polarity of the bond affects how much energy is absorbed. Symmetrical non-polar bonds in N=N and O=O are unable to interact with an electric field, hence they cannot absorb radiation.
- Centimetre inverse, denoted by the sign cm-1, is the most commonly used unit for wavenumber in IR spectra. IR wavelength measurements are frequently expressed in terms of micrometres, sometimes known as "microns," with the sign "μm" which have a reciprocal relationship with wavenumber.
- A Fourier transform infrared (FT–IR) spectrometer is a typical laboratory apparatus that makes use of this approach.
- IR Spectroscopy finds infrared light frequencies that are absorbed by molecules. Due to the fact that these particular light frequencies match the frequency of the bonds in molecules, molecules have a tendency to absorb them.
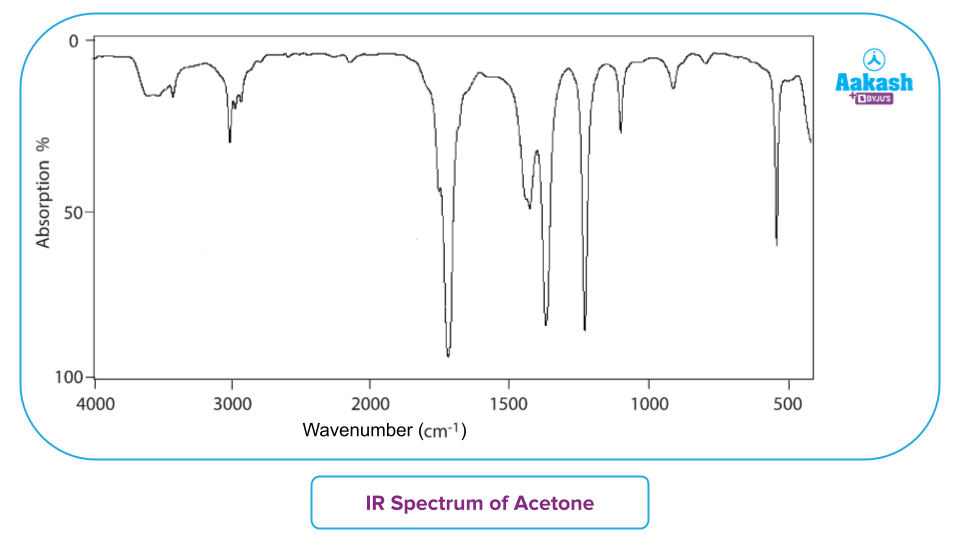
- An IR spectrum is basically a graph with the frequency or wavelength or wavenumber on the X-axis and the amount of absorbed infrared light on the Y-axis. Below is a diagram demonstrating the several zones that light may be categorised into.
IR-Spectroscopy – Regions
- The near, mid, and far-infrared portions of the electromagnetic spectrum are typically separated into these three groups based on how closely they resemble the visible spectrum.
- The higher-energy near-IR, which has a wavelength of 0.7–2.5 μm and range of 14,000–4,000 cm-1, can stimulate overtone or combination modes of molecular vibration.
- The basic vibrations and related rotational-vibrational structure are often studied in the mid-infrared, which ranges in wavelength from 4,000 to 400 cm-1(2.5 to 25 μm).
- Low energy and suitable for rotational spectroscopy and low frequency vibrations, the far-infrared ranges in wavelength from 400 to 10 cm-1 (25 to 1000μm).
- Terahertz, or the range from 2-130 cm-1 is the range that borders the microwave zone and may detect intermolecular vibrations.
- Most of the infrared absorption bands for covalent type of bonds is seen within the range of 600-4000 cm-1.

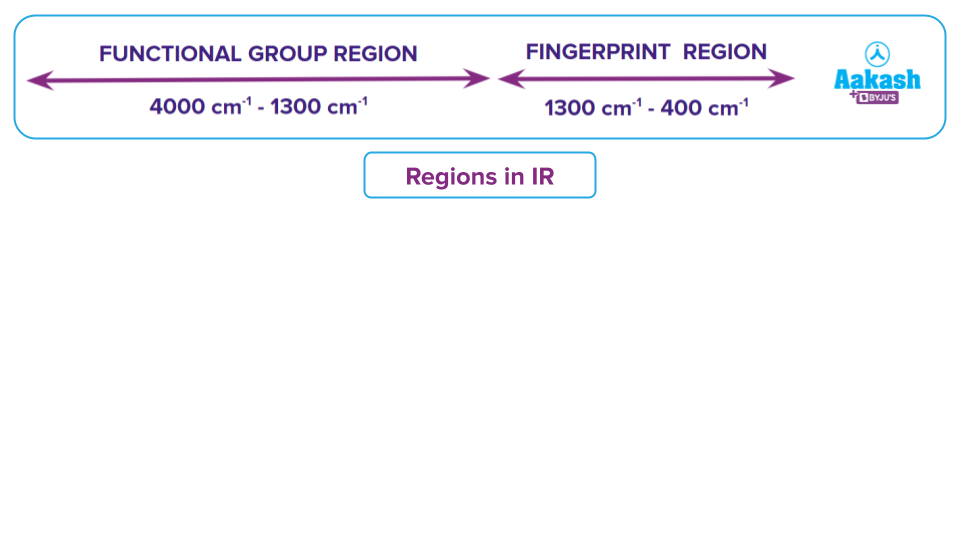
- The majority of the bands that identify the functional group are located in the range of4000 to 1300 cm-1. It is possible to recognise their bands and utilise them to ascertain the functional group of an unidentified molecule.
- The area between 1300 and 400 cm-1, known as the fingerprint region, has bands that are unique to each molecule and resemble a fingerprint. These bands are solely utilised to contrast the spectra of various compounds.
IR-Spectroscopy – Principle
IR Spectroscopy is used to comprehend the properties of a bond. Therefore, the IR spectrometer's operating concept is based on the dipole moments that the bond experiences.
As an illustration, consider the polar character of the covalent connection created when oxygen and hydrogen share electrons. The strong disparity in electronegativity between the two atoms is what causes this polarity. As a result of its polarity, the covalent bond also exhibits a dipole moment. The bond has the capacity to absorb energy from the incident light's wavelength thanks to this charge difference.
- The infrared spectrum's various wavelengths will be absorbed by the bond present in the functional group depending on the polarity of the functional group present in the molecule.
- The vibrational frequency of the bond matches the frequency of the absorbed wavelength of light; this is known as resonating frequency. The IR frequency absorbed is corresponding to the characteristic resonant frequency of each molecule. The infrared absorptions take place at resonance frequencies, meaning that the vibrational frequency and the frequency of the radiation being absorbed are the same.
- The majority of infrared radiation is thermal energy.
- It causes covalent bonds, which can be thought of as springs holding together two masses, or atoms, to vibrate more strongly.
- Particular bonds react to (absorb) particular frequencies (resonant frequency).
- Covalent bonds have a variety of vibrational modes, such as stretching, wagging, twisting, rocking, and scissoring,
- The most useful infrared spectrum bands correlate to stretching frequencies. When a chemical sample is exposed to infrared light, certain frequencies are absorbed and the remainder is transmitted. Additionally, some of the light may be reflected back.
- The detector determines the values of the absorbed frequencies as well as the transmitted frequencies by detecting the transmitted frequencies and thus produces the IR spectra of a particular molecule.
Classification of Bands in IR Region
Infrared bands can be categorised as strong (s), medium (m), or weak (w) based on how intense they are compared to one another. Most of the y-axis (% Absorbance or Transmittance) is covered by a wide band. A weak band drops to roughly one-third or less of the y-axis, whereas a medium band drops to around half.
- Not all covalent bonds exhibit IR spectra bands.
- Polar bonding alone can achieve this. We refer to these as IR active. The size of the dipole moment connected to the bond in issue determines how strong the bands are.
- Medium polarity bonds and asymmetric bonds result in medium bands, whereas very polar bonds, such as carbonyl groups (C=O), result in strong bands.
- Symmetric bonds and weakly polar bonds result in weak or undetectable bands.
IR-Spectroscopy – Sampling
Infrared spectroscopy may be utilised with materials that are solid, liquid, or gaseous.
- Solid Samples: By crushing the sample with a mulling agent that has an oily texture, solid samples can be created. This mull may now be spread thinly on a salt plate for measurement.
Mulling is a typical technique for getting ready solid samples for IR examination. The idea is to reduce scattering by reducing the particle size to less than the wavelength of incoming light that will pass through. An oil, or paraffin, which is called the mulling agent is used to suspend such minute solid particles of the sample. For infrared spectroscopy of solid samples mulling is done, where a sample is ground into a fine powder using a mortar and pestle and then suspended in paraffin (or mineral oil).
- Liquid Samples: Since salt plates are transparent to IR light, liquid samples are often held between two of them while being analysed. Sodium chloride, calcium fluoride, or even potassium bromide can be used to make salt plates.
- Gas Samples: Due to the possibility of parts per million concentrations in gaseous samples, the sample cell must have a comparatively long path length or a relatively long distance for the light to travel. Consequently, samples of various physical states cn be analysed using IR spectroscopy.
IR-Spectroscopy – Instrumentation
Here is an illustration of the instrumentation of infrared spectroscopy. It has the following components: two pairs of splitters, sample solution, a monochromator, an infrared light source, a digital reader, a reference or standard solution and a detector.
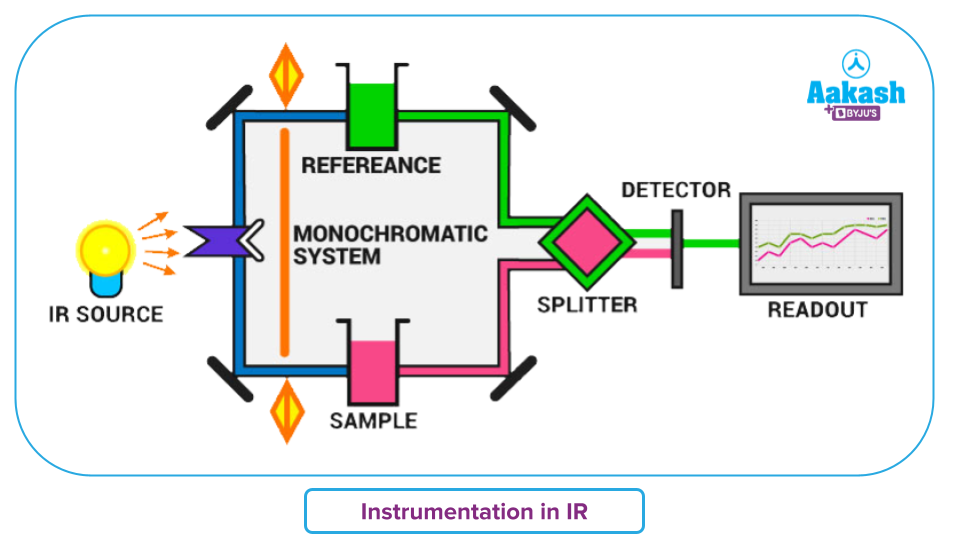
- A source of radiant energy that generates IR radiation that is constant, strong enough to be detected, and spans the correct wavelength is needed for IR sensors. Example: Nichrome wire, Nernst glower, Mercury arc, Incandescent lamp, Glover source etc.
- The monochromator is a tool for dividing or dispersing a wide range of infrared energy into discrete narrow infrared frequencies. Example: filters, prisms and gratings. Prism can be made for sodium chloride, potassium bromide etc.
- The intensity of infrared light that is transmitted is measured using detectors.
- It uses detectors including a bolometer, pyroelectric, thermistor, and Golay cell, thermocouple.
- Read-outs or recorders portray the IR spectrum graph.
IR-Spectroscopy – Working and Detection
- The sample and reference solutions are inserted in their relevant slots. Utilising a reference serves to cancel out any potential systemic factors that are not related to the sample under study.
- The IR light source is turned on when the components are properly positioned. This light source is split into two beams with the use of splitters, one of which passes through the sample and the other via the reference.
- Another pair of splitters help to concentrate the transmitted light that travels through the sample and reference before it is directed onto the detector. A photomultiplier tube can be used as the detector.
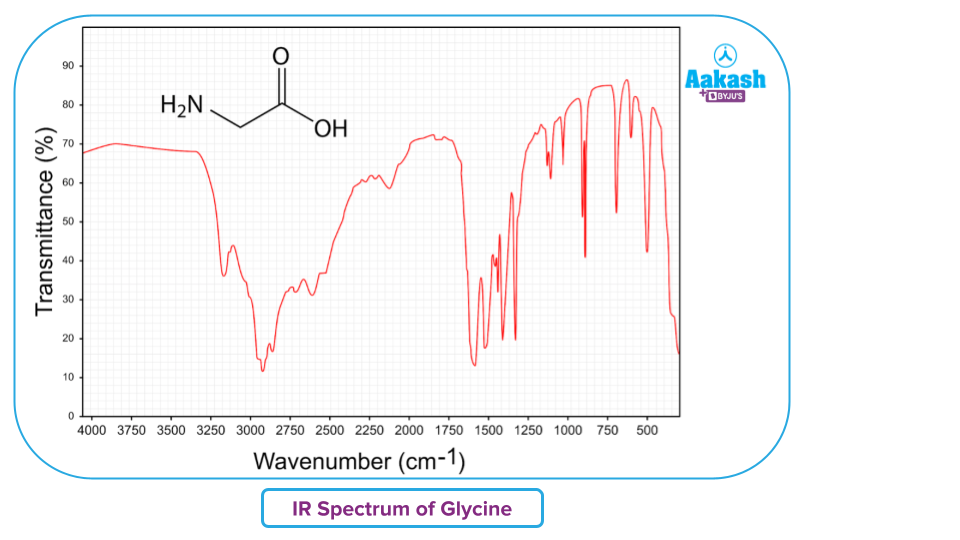
- This detector determines the spectrum of light absorbed, amplifies the signal, and provides it to the reader for interpretation via the graphical representation of the IR spectra. Here is an example of IR spectra in transmission mode.
IR-Spectroscopy – Applications
- Inorganic and organic chemistry, as well as research and business, both, rely heavily on the simple infrared spectroscopy approach.
- IR spectroscopy is used in the characterisation of proteins.
- It is used in space exploration and in the study of nanoscale semiconductors.
- It is also used in the analysis of materials that are solid, liquid, or gaseous and various such quantitative research.
- The IR spectrum can be used to infer details about a molecule's composition and functional groups.
- Characterising the catalyst and spotting intermediates and products throughout the catalytic process are both highly helpful techniques in catalysis research.
- Applications include the long-term, unattended measurement of CO2 concentrations in greenhouses and growth chambers using infrared gas analysers and for quality control, dynamic measurement, and monitoring.
- Additionally, it is employed in forensic investigation for both civil and criminal cases. For instance, to spot polymer deterioration. It may be used to measure a suspected drunk driver's blood alcohol level.
- Using IR spectroscopy, pigments in paintings and other works of art have been effectively analysed and identified, among other applications.
- Measurement of the degree of polymerisation during the production of polymers may also be done using infrared spectroscopy.
- The food business uses infrared spectroscopy to quantify the concentration of various substances in various food items, which is a significant additional use.
- Devices for finding gas leaks also employ infrared spectroscopy. When crude oil and natural gas are being transported, these instruments look for hydrocarbon gas leaks.
- NASA unveiled an enormously improved database for monitoring polycyclic aromatic hydrocarbons (PAHs) in the cosmos in February 2014. The database is based on IR spectroscopy.
- According to researchers, PAHs, which may serve as the building blocks for the emergence of life, may account for more than 20% of the carbon in the universe.
Practice Problems
Q1. Mention the one which is IR inactive.
A. N2
B. CH3COOH
C. CH4
D. H2O
Answer: A)
Solution: A bond which is polar or has induced or temporary dipoles too, (has negative and positive charge) can interact with infrared radiations of the electromagnetic spectrum. Diatomic compounds with a single nucleus do not have IR spectra. Homonuclear diatomic compounds like H2, N2, and O2 don't have a constant dipole moment, nor does the stretching of the atoms around the bond produce one. As a result, homonuclear compounds lack any IR spectra.
So, option A is the correct answer.
Q2. Mention an infrared source of radiation used in IR spectroscopy.
Answer: A source of radiant energy that generates IR radiation that is constant, strong enough to be detected, and spans the correct wavelength is needed for IR sensors. A few examples of IR sources are Nichrome wire, Nernst glower, Mercury arc, Incandescent lamp, Glover source etc.
Q3. What is the molecular effect of infrared radiations?
A. Ionisation
B. Nuclear Spin Transition
C. Rotational Motion
D. Molecular Vibrations
Answer: D)
Solution: A portion of the energy from infrared radiation that interacts with a specific molecule (polar), has a certain frequency and when it matches the molecule's inherent frequency, it resonates and the radiation is absorbed; the remaining radiation is transmitted. The molecules gain energy and begin to vibrate more vigorously as they take in this radiation.
So, option D is the correct answer.
Q4. Which type of vibrations does the IR spectrum give more predominant bands?
A. Stretching
B. Wagging
C. Twisting
D. Scissoring
Answer: A)
Solution: Covalent bonds have a variety of vibrational modes, such as stretching, wagging, twisting, rocking and scissoring. The most useful infrared spectrum bands correlate to stretching frequencies as they are of higher frequencies showing predominant bands. The 4000 to 1450 cm-1 range, also known as the group frequency zone, contains absorption bands that are often caused by the stretching vibrations of diatomic molecules.
So, option A is the correct answer.
Frequently Asked Questions – FAQ
Q1. What kind of solvent is employed in IR spectroscopy?
Answer: Solvents that are usually transparent in the important absorption regions of the spectrum are chosen. Also depending on the samples to be used, we use the principle of ‘like dissolves like’ while choosing an ideal sample. The two most common solvents are carbon tetrachloride (CCl4) and carbon disulfide (CS2). Chloroform, methylene chloride, acetonitrile, and acetone are polar solvents. Solids that have been ground into tiny pieces can be examined as a thin paste or mull.
Q2. How sensitive is the analytical method of IR spectroscopy?
Answer: A sample as little as 1-10 g may now be identified using infrared spectroscopy. Infrared spectroscopy may be used to analyse almost all organic compounds as well as certain inorganic ones. It has several uses and may be utilised in both qualitative and quantitative analysis.
Q3. Is water suitable for IR spectroscopy?
Answer: Water cannot be used as a solvent for IR spectroscopy because it contains two strong infrared absorption peaks. Additionally, alkali halide discs, which are widely used in IR, may be dissolved in water since it is a polar solvent.
Q4. What is the significance of KBr in IR spectroscopy?
Answer: Since KBr is optically transparent to light in the IR measurement region, it is utilised as a carrier for the IR spectrum sample, so that there would be no interference with absorbance. KBr has a transmittance of 100% in the wave number range (4000-400 cm-1).