-
Call Now
1800-102-2727

Pedigree Analysis: History, Pedigree Chart, Types of pedigrees with examples, Significances, Example, Practice Problems and FAQs

We all are so blessed to be born in this world. All individuals may not be perfect but we all are able to go to school and pursue our dreams. But just check your surroundings, you can see individuals with some birth defects or genetic disorders and some are not able to attend the regular schools. Examples include Cri du chat syndrome, Down’s syndrome etc.
Even though these people have some genetic defects, they are able to cope up with situations because of training and are able to do something productive. So understanding about the condition and proper guidance on time are required for both parents and offsprings regarding this. One of the famous cases is about Ms.Aditi. You might have heard about her. We will be really surprised and motivated after reading her story. She is a warrior in spite of being affected by Down's syndrome. She runs a cafe. Like her there are so many achievers who are becoming successful in their respective fields and are breaking all the odds and barriers.

Fig: An amazing Ms. Aditi
But have you ever thought about these types of genetic disorders? Why are these types of genetic disorders happening?. If the parents have some genetic defects or if this type of a trait is running in the family, can we stop it? Can we predict the occurrence in the next generation?
Yes, it is possible. For example, if one of the parents has a family history of thalassemia, they can go to a genetic counsellor to predict the possibility of thalassemia in their offspring. The counsellor studies the family history and on the basis of that they prepare a pedigree chart. This shows the prediction of a disease in the coming offspring. With the help of a pedigree chart, we can also determine the inheritance pattern of a particular trait. Does this look amazing? Let’s understand pedigree analysis in depth in this article.
Table of contents
- Pedigree analysis
- History of pedigree analysis
- Pedigree Chart
- Types of pedigrees with examples
- Significance of pedigree analysis
- Examples of pedigree analysis
- Practice problems
- FAQ’s
Pedigree analysis
Pedigree analysis is the study of a specific attribute that is passed down from generation to generation. It aids in interpreting the pattern of inheritance for a specific characteristic, as well as determining if the trait is dominant or recessive. Scientists utilise pedigree analysis to analyse the inheritance of phenotypes, or traits, in numerous contexts, including various plant and animal species, by utilising mating experiments termed crosses.
History of pedigree analysis
Mendel's research demonstrated that 'factors,' commonly known as genes, are responsible for inheritance. Genes are also responsible for various types of genetic disorders that occur in living organisms. These are considered as the hereditary unit of organisms. Genes regulate the structural and functional changes in an organism. Aside from that, it is the source of variation in organisms, which can result in either a positive or negative feature. These conclusions were derived on the basis of controlled experiments performed by Mendel. He performed controlled crosses on pea plants and other organisms. These experiments cannot be performed on the human population because of some ethical issues. So, this limitation can be solved by pedigree analysis which involves observing and analysing the pattern of inheritance using family history.
Human Genetics
The study of inheritance of characters in human beings is called Human Genetics. Alkaptonuria or the black urine disease is the first one studied in this field of Biology by Sir Archibald Garrod. He is hence known as the father of Human Genetics. Pedigree analysis is one of the important techniques used in Human Genetics.
Fig: Sir Archibald Garrod
Application of pedigree analysis
DNA is composed of various sequences of nitrogenous bases which in turn code a particular protein. Any alteration in the DNA sequence during DNA replication leads to the change in genetic code or chromosomal aberrations. These sequences can be inherited from one generation to the next. The inheritance of defective genes causes genetic disorders in an offspring. This is known as Mendelian disorder that occurs due to alteration only in one gene. Mendelian disorders are most commonly found in families with a specific pattern reflecting a single gene mutation. These disorders can be predicted based on family history and with the use of a family tree. Pedigree analysis is the process of examining a family's lineage over several generations. Pedigree analysis is a powerful approach in human genetics that can assist to predict inheritance patterns even when data is limited.
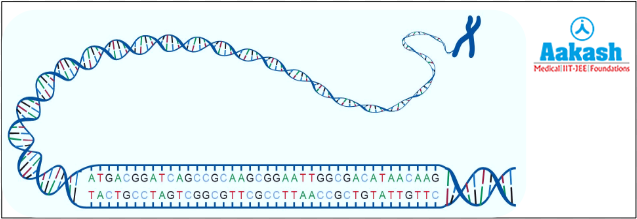
Fig: DNA
Pedigree chart
A pedigree chart is a tabular representation of a family tree that shows how a trait or disease is passed down through generations.They could be suffering from a hereditary condition or be disease carriers. Standard symbols are used in pedigree analysis to distinguish between various individuals. A diagrammatic representation of a pedigree chart is given below:

Fig: Representation of a pedigree chart
Symbols used in the pedigree chart
- The rows indicate generations of a family in the pedigree chart.
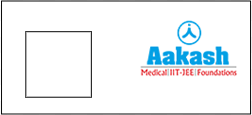
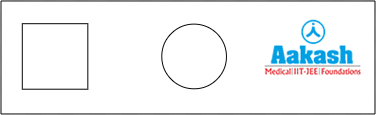
- The squares and circles represent males and females, respectively.
- The people in the same row are from the same generation.
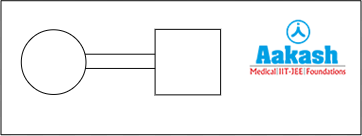
- A horizontal bar between the square and the circle represents a marriage or mating.
- A consanguineous (marriages between relatives) mating or marriage is indicated by a double bar between the symbols.
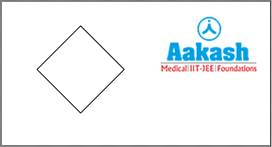
- The symbol of a black diamond indicates that the sex is unspecified and affected.
- A vertical line suspended perpendicular to the horizontal bar or marriage bar indicates the offspring.
- Individuals who are homozygous and affected by the trait are shown as fully darkened symbols.
- Individuals who are heterozygous or carriers are indicated by half-shaded symbols.
- Wild type refers to a normal or natural genotype.
- Individuals that are normal or unaffected are represented by unshaded squares and circles.
- A black mark in the middle of the symbol represents the carrier of a sex-linked recessive gene.
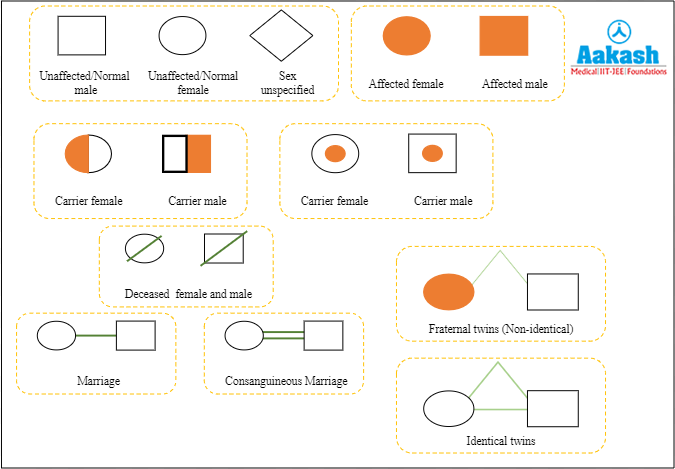
Fig: Common symbols used in pedigree analysis
Method of preparation of pedigree chart
The following steps are followed while making a pedigree chart:
- Collect information about the family’s history for the particular trait under study.
- Assemble the expression of the trait into a family tree.
- Study the inheritance of trait and understand whether it is dominant, recessive or sex-linked.
Types of pedigrees
On the basis of mode of inheritance, pedigree analysis is classified into five types. That are listed below:
- Autosomal dominant
- X-linked dominant
- Autosomal recessive
- X-linked recessive
- Y-linked
Autosomal dominant
When a disease is produced by a dominant allele of a gene, everyone who carries that allele will develop disease symptoms. Only one allele is able to affect the individual here. As a result, every affected person must have a parent who is also affected. Autosomal dominant is characterised by a pedigree with affected individuals in each generation. If the affected parent is heterozygous, there is a possibility with no affected children in a family. Examples of autosomal dominant traits are brachydactyly, polydactyly and dimple in the cheek.
Characteristic features of autosomal dominant inheritance
- Transmission of trait occurs from parents to either sex.
- Males and females can be equally affected.
- The pedigree is vertical, which means that the trait is marked as present in all generations.
- Typically, multiple generations are affected.

Fig: Inheritance of autosomal dominant trait
X-linked dominant
In X-linked dominant inheritance, the disease-causing gene is found on the X-chromosome, and the disease-causing allele is dominant over the normal allele in females. Females have twice as many X-chromosomes as males, hence they are more likely to be influenced in the population than males. The X-linked dominant disorders are inherited by males from their mothers because they inherit their X chromosome from mothers. Example of this disorder is oral facial digital syndrome.
Characteristic features of X-linked dominant inheritance
- The trait can be found in almost every generation, and it is passed down vertically.
- If the mother is affected, approximately half of her sons are also adversely affected.
- All of the male's daughters will be affected if he is affected, but none of his sons will be affected.
- There is no male to male transmission of disease in this inheritance.
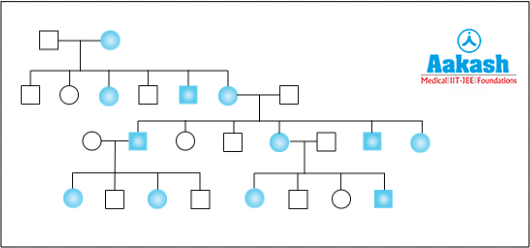
Fig: Inheritance of X-linked dominant trait
Autosomal recessive
Autosomal recessive diseases require at least one copy of the disease allele in both parents of an affected individual. Most of the individuals having autosomal recessive traits are carriers. Autosomal recessive trait is distinguished from autosomal dominant and X-linked dominant in a way that affected offsprings have unaffected parents. These traits can skip a generation. The common example of this type of trait is albinism.

Fig: Albinism
Salient features of autosomal recessive inheritance
- Multiple male and female siblings, whose parents are normal but carriers, had an equal number of cases.
- The siblings are homozygous for the defective allele, but their parents are clearly heterozygous, that means they are only carriers of the trait, even if some of them appear normal.
- Consanguinity occasionally results in the appearance of such traits.
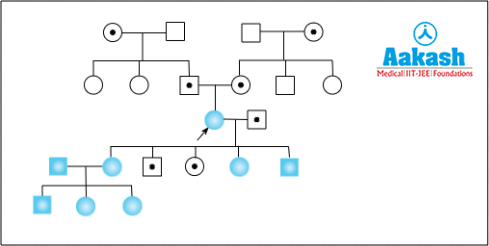
Fig: Inheritance of autosomal recessive trait
X-linked recessive
Due to the fact that males only have one X-chromosome, any male who inherits an X-linked recessive disease allele will be affected. Therefore, in this type of inheritance, males tend to be affected more frequently as compared to females in a population. This type of inheritance can be seen in red green colour blindness and haemophilia.
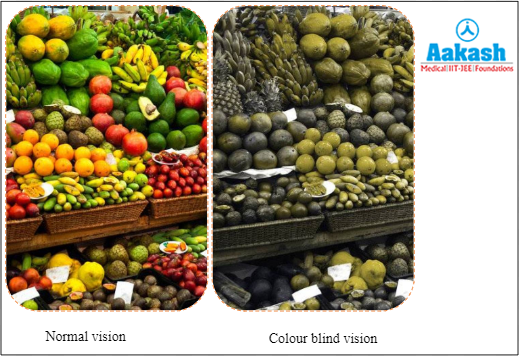
Fig: Red green colourblindness
Salient features of X-linked recessive inheritance
- Females only show the trait if they are homozygous for the mutant allele.
- Men show it even if they are hemizygous.
- The males are most affected by this trait.
- Half of the sons of carrier females are affected.
- If the female is homozygous, all of her sons and 50% of her daughters are affected.
- Affected individuals are related to one another through their maternal family.
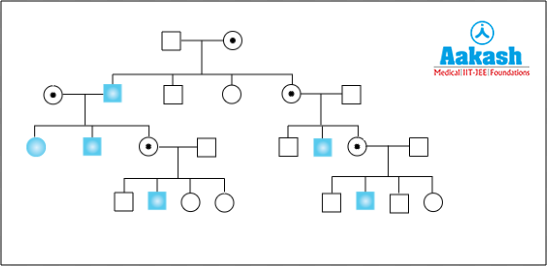
Fig: Inheritance of X-linked recessive trait
Y-linked inheritance
It is a rarest type of inheritance in which only males are affected. The disease transfers from father to son. As expected, all sons inherit this feature from their father, but no daughters. Y-linked inheritance is also called holandric inheritance. Examples include hypertrichosis of the ears (hairy pinna), porcupine man and webbed toes.
Salient features of Y-linked inheritance
- Y-linked inheritance occurs only in males.
- It usually appears in all sons of males.
- It is absent in daughters as the father cannot transfer the Y-linked genes to the daughters.
- The daughters appear normal phenotypically.
- Daughters cannot become the carriers of the disease trait.
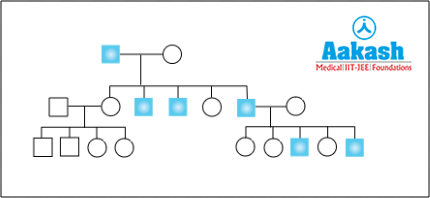
Fig: Y-linked inheritance
Significance of pedigree analysis
The pedigree analysis has following significances:
- It allows for a better understanding of how genes are passed down within a family.
- It can aid in the prediction of a disease that runs in the family.
- It is useful in genetic counselling to inform the couples whether their child has any genetic defect or not.
- It provides a graphic representation of the structure and medical history of the family.
- It helps to determine the genotypes.
- It helps to identify phenotypes.
Example of pedigree analysis
Let’s take an example of X-linked recessive disease. The gene for this disease shows criss cross inheritance. It means if a mother is a carrier, the disease is passed to the son and he becomes affected. She may or may not transfer the trait to the daughter. But if the father is affected then the trait is passed to the daughter and she becomes the carrier, but the son neither becomes the carrier nor affected. Examples include haemophilia.
Let’s take a condition in which a carrier mother is married to a normal father. The disease is inherited in a criss cross manner. The son becomes affected and the daughter becomes the carrier in this case. The pedigree chart is shown below:

Fig: Pedigree chart of X-linked recessive disease
Practice Problems
- Identify the incorrect statement regarding pedigree analysis:
a) Solid symbols show unaffected individuals
b) The proband is the one who begins the case narrative
c) It is a study of a family's traits through numerous generations
d) It is useful for genetic counsellors
Solution: The examination of a certain trait that is passed down from generation to generation is known as pedigree analysis. It assists in establishing whether a trait is dominant or recessive, as well as evaluating the pattern of inheritance for a certain trait. The proband is the first individual in a family to undergo genetic counselling and/or testing for a suspected hereditary illness. It could be affected by the disorder or not. Individuals who are affected are shown by solid symbols. Individuals who are unaffected or normal are not depicted by solid symbols. Hence, the correct option is a.
2. Determine the incorrect match.
- Consanguineous mating
- Female
- Unspecified sex
- Unaffected individuals
Solution: A female is represented by a circle not by a square on a pedigree chart. Marriage between two close relatives is known as consanguineous mating. It is indicated by a double bar between the symbols. The term ‘sex unspecified’ refers to the lack of information about a person's sexual orientation. The symbol of a black diamond indicates that the sex is unspecified and affected. Individuals who are not affected are those who are not having the disease. They are represented by symbols that are not made up of solid colours. Hence, the correct option is b.
3. What are the purposes of pedigree analysis?
Answer: The mode of inheritance is determined through pedigree analysis, which might be recessive, dominant, partial dominant, autosomal, mitochondrial, or sex-linked. It allows for a better understanding of how genes are passed down within a family. It can aid in the prediction of a disease that runs in the family. It is useful in genetic counselling to inform the couples whether their child has any genetic defect or not.
4. How can a person differentiate between autosomal linked dominant and X-linked dominant pedigree chart?
Answer: In autosomal linked dominant inheritance, both the sexes get equally affected. On the other hand, the X-linked dominant inheritance shows a criss-cross inheritance, that means the disease is transmitted from the father to the grandson through the daughter. But there is no male to male transmission of traits here. Examples of X-linked inheritance include haemophilia.
FAQs
- How many generations must be there in a pedigree chart?
Answer: If a person is making a pedigree chart, it must include at least three generations. This allows us to determine the inheritance pattern of a particular trait.
- What is the history of a pedigree?
Answer: The word pedigree comes from the French term ‘pied de gru’, which means ‘crane's foot.’ This is because of the fact that the chart's lines and split lines resemble the crane's little foot and delicate leg.
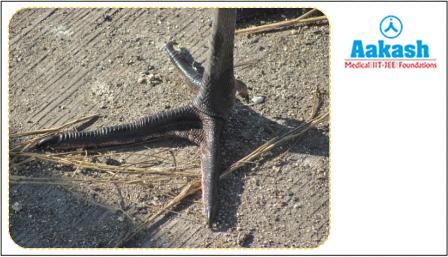
Fig: Foot of a crane
- How is the pedigree chart related to the family tree?
Answer: The family tree is represented by a pedigree. It shows how family members are related to one another. One can also tell which people have a specific trait or genetic problem through this.
- Why are pedigree charts commonly used on humans instead of controlled experiments?
Answer: Human geneticists must rely on naturally occurring mutations and existing family histories instead of using genetic procedures like mutant screens and controlled crosses on human subjects. Hence the pedigree charts commonly used on humans instead of controlled experiments