-
Call Now
1800-102-2727

Hydrogen spectrum-definition, types, Practice problems,FAQs

Rick is a mad physicist who is obsessed with finding new things. One day, his close scientist friend Ben stumbles upon an element whose composition he doesn’t know. In order to find this out, he calls up Rick and they both bring a certain piece of equipment called a “spectrometer”. When the element was kept inside the spectrometer, the individual components were detected and measured. How ? Inorder to understand this, we must understand the concept of “atomic transition”; which denotes electrons jumping between different levels in an atom. In this process, photons (quantum of radiation) having energy and frequency are emitted. This helps to analyse the elements. Experiments conducted in the late 1800s proved that when gas molecules are excited and when subjected to an electric discharge, the light emitted is analysed using a diffraction grating. The resulting diffraction pattern consists of a series of lines called “spectrum”. In other words, the spectrum consisted of a continuous band of light, but of individual lines with well-defined wavelengths. Hydrogen is no exception when it comes to showing a distinct spectrum due to atomic transitions. In this article, let’s explore the hydrogen spectrum in detail.
Table of contents
- What is the hydrogen spectrum?
- Emission spectrum
- Absorption spectrum
- Energy levels of an atom
- Spectral lines of hydrogen and Rydberg’s formula
- Practice problems
- FAQs
What is the hydrogen spectrum?
When an electric discharge is applied to hydrogen, its molecules start to dissociate; as a result, they emit electromagnetic radiation. The hydrogen spectrum consists of bright lines in a dark background of discrete frequencies; these frequencies are named after the scientists who discovered them.
Emission spectrum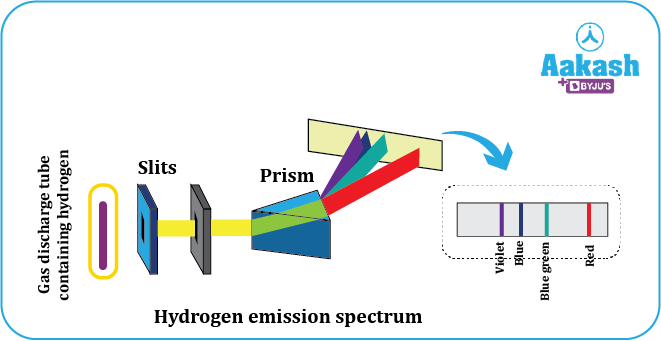
An emission spectrum is the series of lines which are emitted when an electron in the higher energy state transitions into a lower energy level thereby emitting energy in the forms of photons. It consists of bright lines in a dark background.
1) Continuous spectrum
A continuous spectrum contains all the wavelengths. They go from violet to red and when they lie in the visible region, can be seen by the naked eye.
2) Line spectrum
A line spectrum has discrete lines with dark spacing between them and does not consist of all the wavelengths like the continuous spectrum.

Fig showing emission spectrum
Absorption spectrum
An absorption spectrum is the series of lines which are emitted when an electron in the lower energy level transitions into a higher energy level by absorbing energy in the forms of photons in the process. It consists of dark lines in a bright background. The dark patches are the light waves of those wavelengths which are absorbed by the electrons.

Fig showing absorption spectrum
Energy levels of an atom
The total energy of an electron in the nth orbit is given by,
1 is called the Rydberg’s constant.
denotes Planck’s constant.
denotes the speed of light.
Z- atomic number of the element.
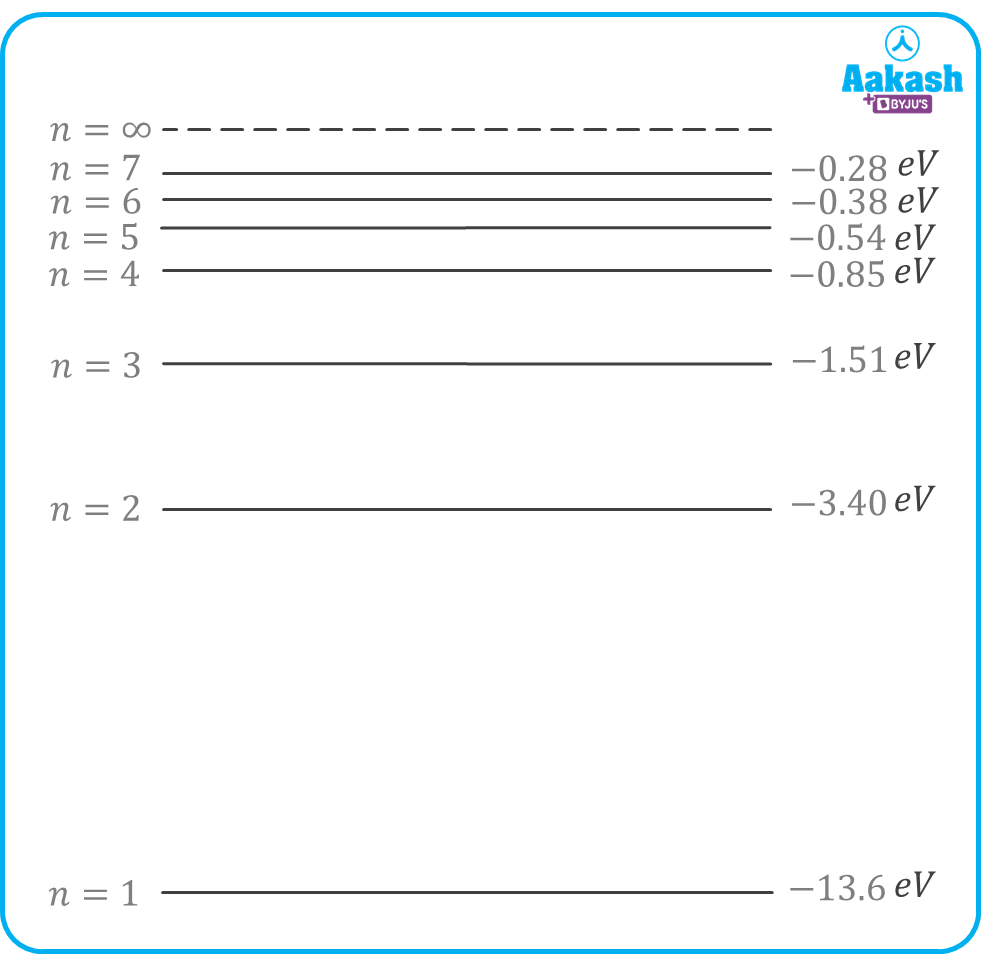
Fig showing different energy levels of an atom
Substituting the above values, we get
eV stands for electron volt. .
For an electron in the ground state of a hydrogen atom, Z=1,n=1
In the first excited state,n=2
In the second excited state , n=3
As the value of n increases, the energy of the electron increases.
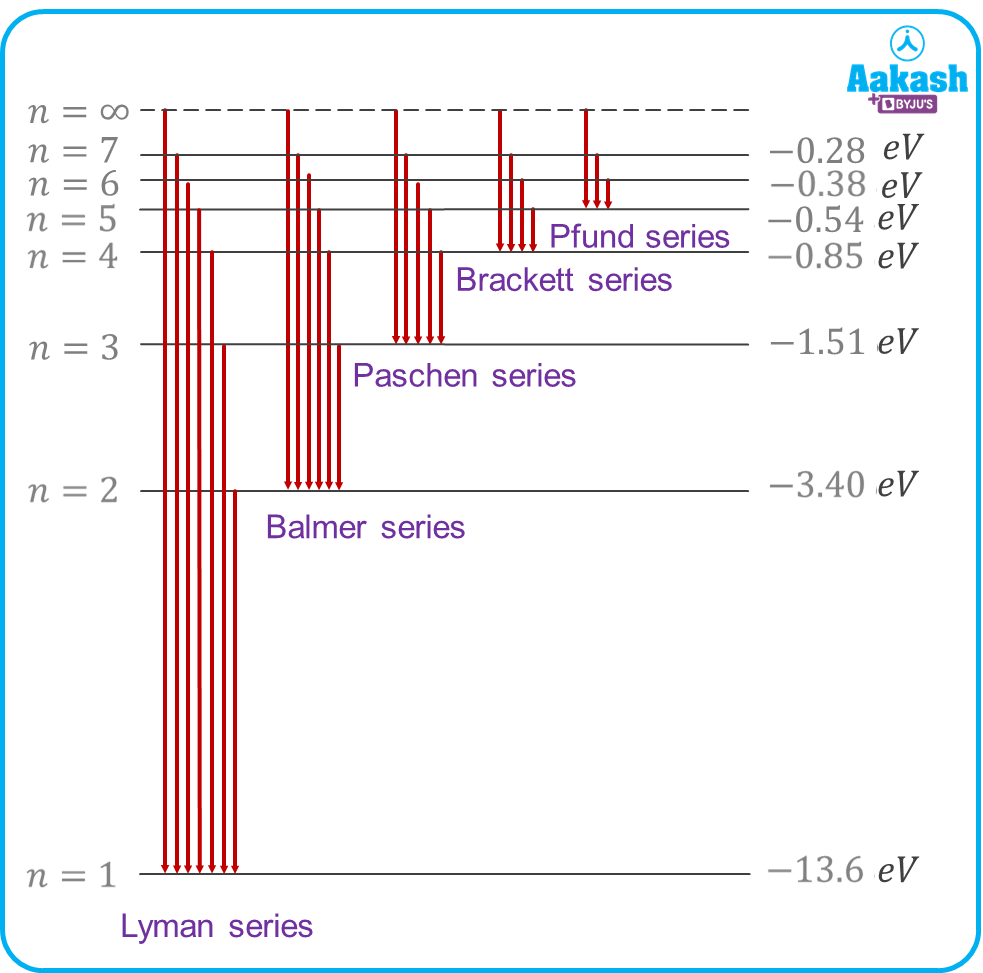
Spectral lines of hydrogen and Rydberg’s formula
Hydrogen has its own emission spectrum caused by atomic transitions. Let nf be the final level and ni be the initial level from where the electron jumps, then the wavelength of the emitted photon can be calculated as
Here, R= Rydberg constant
Note:
is called the wave number.
1) For Lyman series
The Lyman series lies in the Ultraviolet region of the EM spectrum.
2) For Balmer series
It lies in the visible region of the EM spectrum.
3) For Paschen series
It lies in the infrared region of the EM spectrum.
4) For Brackett series
It lies in the infrared region of the EM spectrum.
5) For Pfund series
It lies in the infrared region of the EM spectrum.
For the series limit of any series,
Practice problems
Q1. Calculate the largest and shortest wavelengths in the Brackett series for hydrogen ?
For the Brackett series,
Let indicate the largest wavelength and shortest indicate the shortest wavelength. Then
For the shortest wavelength, wave number should be maximum
Let indicate the maximum wavelength. For the longest wavelength, wave number should be minimum
Q2. Calculate the ratio of the largest to the shortest wavelengths in the Paschen series of hydrogen.
(a) (b) (c) (d)
Answer. c
For the Paschen series,
Let indicate the largest wavelength and shortest indicate the shortest wavelength. Then
For the shortest wavelength,
For the longest wavelength,
Q3. Find the ratio of the longest wavelength corresponding to Lyman and the shortest wavelength in the Balmer series?
(a) (b) ( c ) (d)
Answer. a
For the longest wavelength of the Lyman series, we have
For the shortest wavelength of the Balmer series, we have
;
Q4. Calculate the wave number of the last line of the Paschen series in the hydrogen spectrum. Given, the value of Rydberg’s constant to be .
(a) (b) (c) (d)
Answer. b
For the last line of the Paschen series,
Wave number,
FAQs
Q1. What are the characteristics of the hydrogen spectrum?
Answer. A sample of hydrogen, when excited, emits a characteristic light even in the visible region. When the light is split into its component wavelengths, violet, blue, red and green lines are observed.
Q2. What is the importance of the hydrogen spectrum?
Answer. Hydrogen spectrum is important evidence to show that quantisation of charges is necessary. It also helps to explain why the gas glows when an electric discharge occurs.
Q3. What are the 3 main regions in which the hydrogen spectrum lies?
Answer. Hydrogen spectrum mainly lies in the UV, visible or Infrared region.The Lymann series lies in the UV region, the Balmer series lies in the visible region, while Paschen, Brackett and Pfund lie in the infrared region.
Q4. What is the difference between emission and absorption spectrum?
Answer. Absorption spectrum is mainly exhibited by gases while on the other hand, emission spectrum is mainly shown by solids and liquids. Emission spectrum contains bright lines in a dark background while the absorption spectrum contains dark lines in a bright background.