-
Call Now
1800-102-2727

Atomic spectra, spectral lines and atomic transition-Definition,Practice problems,FAQs

Kaushik is attending chemistry class at his school while his teacher brings up a concept called “atomic transition”. She goes on to tell that atomic transition is used in spectrometers; an instrument used to study the composition of different substances. It absorbs light of different wavelengths and reflects the concentration of each element in the substance. As the lecture goes on, Kaushik looks outside the window and notices rain; after the rain subsides, he notices a rainbow. So what do the rainbow and spectrometer have in common? The answer is a phenomenon called the “atomic spectrum”. In order to understand the atomic spectrum, let us try to visualise electrons in an atom, which lie on different energy levels. While an electron lying in a higher energy level jumps to a lower energy level, it emits energy. In this case it emits photons (termed a quantum of radiation). Not only does an electron jump to a lower level emitting radiation, but also jumps to a higher level when it absorbs energy in the form of photons. This jumping of electrons is termed as atomic transitions which is used in the spectrometers. A spectrum which shows a continuous series of colours which are visible to the naked eye, it is called a continuous spectrum, similar to as seen in the case of the rainbow. So let’s explore about atomic spectrum in detail !
Table of contents
- Atomic spectra
- Emission spectrum
- Absorption spectrum
- Energy levels of an atom
- Spectral lines of hydrogen and Rydberg’s formula
- Practice problems
- FAQs
What is atomic spectra?
A spectrum refers to the characteristic wavelengths of electromagnetic radiation that are emitted or absorbed by substances’ atoms or molecules. It is of two types- emission and absorption spectrum.
Emission spectrum
An emission spectrum is the series of lines which are emitted when an electron in the higher energy state transitions into a lower energy level thereby emitting a photon. It consists of bright lines in a dark background.
1) Continuous spectrum
A continuous spectrum has all wavelengths that go from violet to red and they lie in the visible region which can be seen by the naked eye.
2) Line spectrum
A line spectrum has discrete lines with dark spacing between them and it does not consist of all the wavelengths like the continuous spectrum.
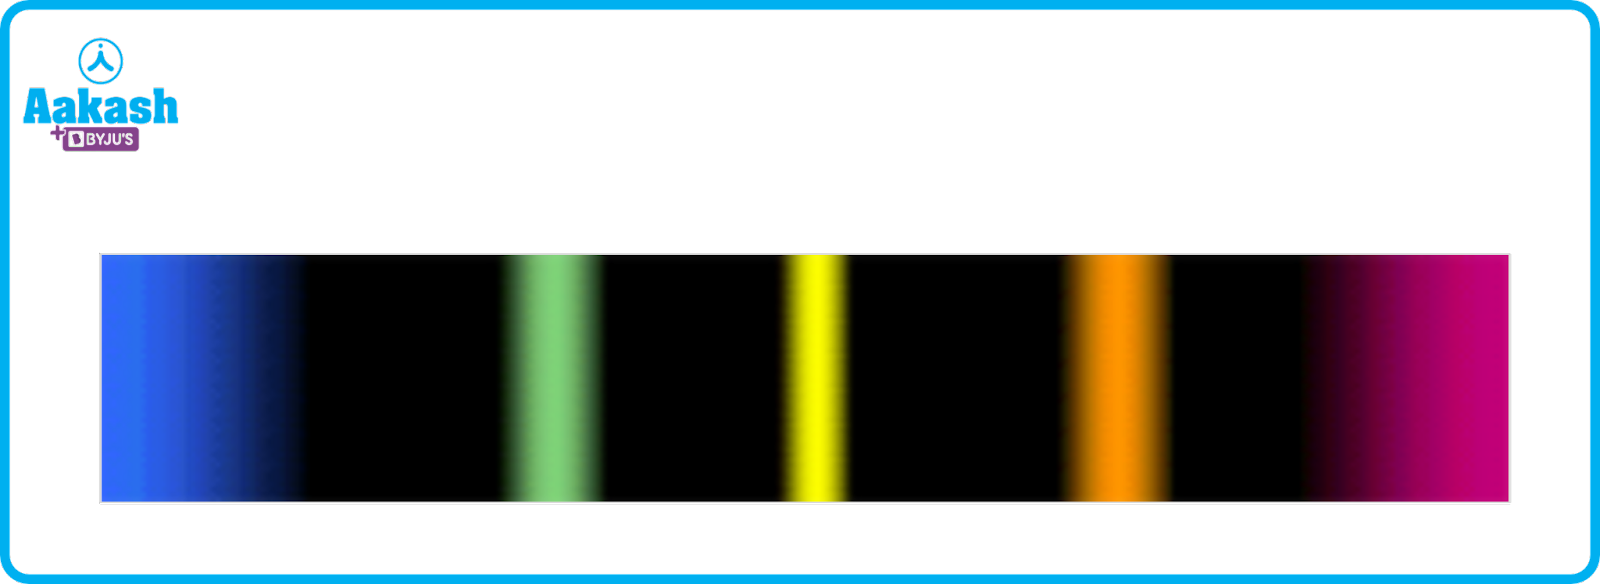
Fig showing emission spectrum
Absorption spectrum
An absorption spectrum is the series of lines which we get when an electron in the lower energy level transitions into a higher energy level by absorbing a photon in the process. It consists of dark lines in a bright background. It implies that the electron absorbed the light energy of wavelengths corresponding to the dark patches.
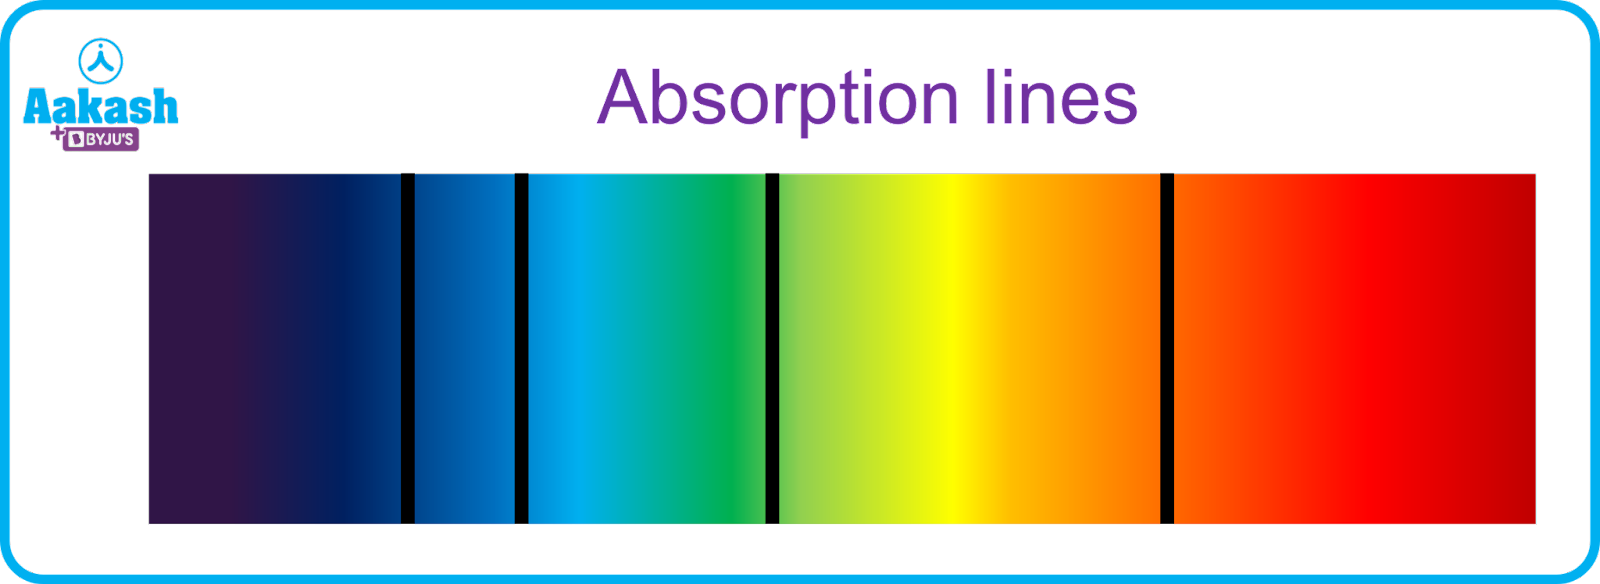
Fig showing absorption spectrum
Energy levels of an atom
The total energy of an electron in the nth orbit is given by,
is called the Rydberg’s constant.
denotes Planck’s constant.
denotes speed of light.
Z- atomic number of the element.
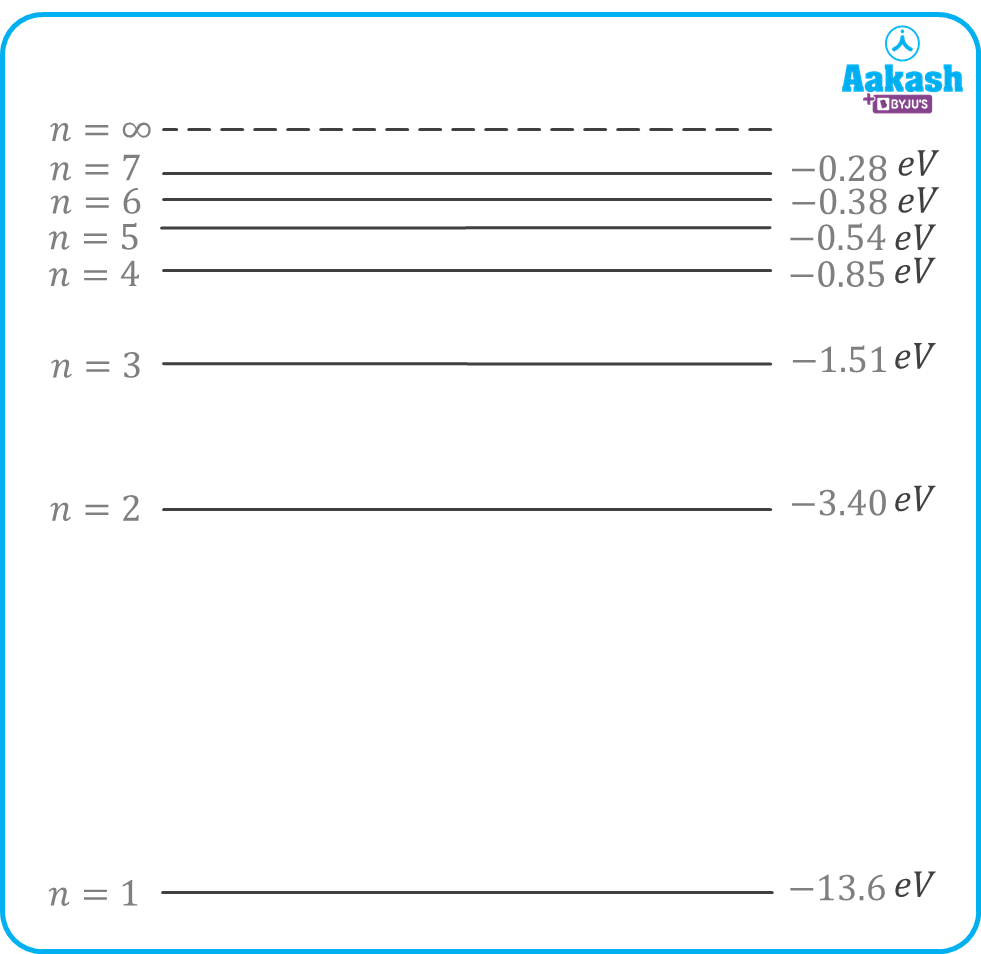
Figure showing different energy levels of a Hydrogen atom (Z=1)
Substituting the above values, we get
eV refers to the energy unit, electron volt. .
For an electron in the ground state of hydrogen atom, Z=1,n=1
In the first excited state, n=2
In the second excited state , n=3
As the value of n increases, the energy of the electron increases.
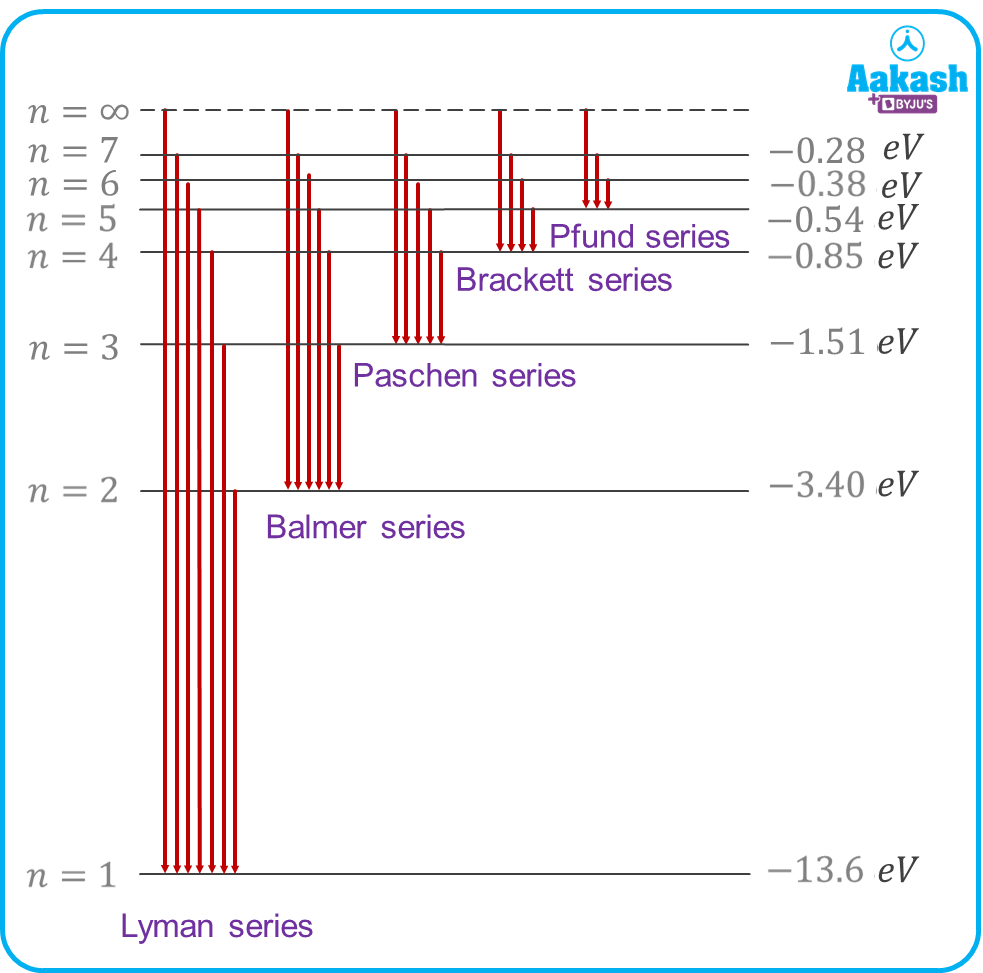
Spectral lines of hydrogen and Rydberg’s formula
Hydrogen has its own emission spectra caused by atomic electron transitions. Let nf be the final level and ni be the initial level from where the electron jumps, then the wavelength of the emitted photon can be calculated as
Note:
is called the wave number.
1) For Lyman series
2) For Balmer series
3) For Paschen series
4) For Brackett series
5) For Pfund series
For the series limit of any series, .
Practice problems
Q1. In which of the following transitions, will the wavelength be minimum?
(a)
(b)
(c)
(d)
Answer. d
We know that the wave number,
Wavelength is minimum when the term is maximum.
In option d, the wave number,
is maximum.
Q2. Calculate the ratio of largest to the shortest wavelengths in the Balmer series of hydrogen.
(a)
(b)
(c)
(d)
Answer. c
For Balmer series,
Let indicate the largest wavelength and shortest indicate the shortest wavelength. Then
For the shortest wavelength,
For the longest wavelength,
Q3. What among the following is the ratio of the longest wavelengths corresponding to the Lyman and Balmer series?
(a) (b) (c) (d)
Answer. a
For longest wavelength of Lyman series,we have
For longest wavelength of Balmer series, we have
Q4. Calculate the wave number of the last line of the Balmer series in the hydrogen spectrum. Given, the value of Rydberg’s constant to be .
(a) (b) (c) (d)
Answer. b
For the last line of Balmer series,
Wave number,
FAQs
Q1. How many types of atomic spectra are there?
Answer. There are three types of atomic spectrum-continuous, absorption and emission spectrum. The continuous spectrum has no gaps in between the consecutive lines. On the other hand, absorption and emission spectrum have dark lines in a bright background and bright lines on a dark background respectively. The latter two are of the discrete spectrum category .
Q2. How are spectral lines used to identify elements?
Answer. Each element has its own emission or absorption spectrum. The photons emitted or absorbed have wavelengths which are distinct to the element that needs to be identified. This makes analysing substances easier.
Q3. Why do different elements have different spectra?
Answer. The absorption spectrum of different elements are different, since each element has a unique number of protons and different arrangements of electrons. This influences the atomic transition to different levels, thereby emitting photons of different wavelengths.
Q4. How are absorption spectra produced?
Answer. Absorption spectra occur when light is passed through a cold, dilute gas– the gas absorbs the energetic photons and the electrons in the gas molecules get excited to higher energy levels, thereby showing an absorption spectrum.